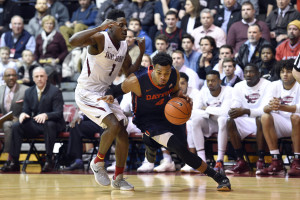
The Atlantic 10 semi-finals tip off at 1:30 p.m. on CBS Sports Network. Here’s your guide:
VCU (23-9/14-4) vs. Davidson (20-11/10-8)
Probable starters:
VCU
Melvin Johnson 18 ppg
Johnny Williams 3.8 ppg
Korey Billbury 11.2 ppg
JeQuan Lewis 10.3 ppg
Mo Alie-Cox 10.5 ppg
Davidson
Jack Gibbs 24.2 ppg
Nathan Ekwu 5.6 ppg
Brian Sullivan 14.1 ppg
Peyton Aldridge 15.7 ppg
Rusty Reigel 2.4 ppg
How they got here
VCU beat UMass, 85-70 in the quarter-finals. Davidson opened with 78-63 victory over La Salle before outlastin St. Bonaventure in overtime, 90-86.
VCU won both regular season meetings by ten points apiece.
VCU Game Notes Davidson Game Notes
TEAM STATISTICS VCU
SCORING 2475
Points per game 77.3
Scoring margin +10.3 –
FIELD GOALS-ATT 897-1990
Field goal pct . 4 5 1
3 POINT FG-ATT 230-640
3-point FG pct . 3 5 9
3-pt FG made per game 7.2
FREE THROWS-ATT 451-653
Free throw pct . 6 9 1
F-Throws made per game 14.1
REBOUNDS 1199
Rebounds per game 37.5
Rebounding margin +2.7 –
ASSISTS 463
Assists per game 14.5
TURNOVERS 374
Turnovers per game 11.7
Turnover margin +4.2 –
Assist/turnover ratio 1.2
STEALS 290
Steals per game 9.1
BLOCKS 123
Blocks per game 3.8
TEAM STATISTICS                    DAV          OPP
---------------------------------------------------
SCORING..................         2480         2416
  Points per game........         80.0         77.9
  Scoring margin.........         +2.1            -
FIELD GOALS-ATT..........     848-1906     887-1937
  Field goal pct.........         .445         .458
3 POINT FG-ATT...........      299-836      239-689
  3-point FG pct.........         .358         .347
  3-pt FG made per game..          9.6          7.7
FREE THROWS-ATT..........      485-636      403-578
  Free throw pct.........         .763         .697
  F-Throws made per game.         15.6         13.0
REBOUNDS.................         1095         1212
  Rebounds per game......         35.3         39.1
  Rebounding margin......         -3.8            -
ASSISTS..................          473          435
  Assists per game.......         15.3         14.0
TURNOVERS................          313          361
  Turnovers per game.....         10.1         11.6
  Turnover margin........         +1.5            -
  Assist/turnover ratio..          1.5          1.2
STEALS...................          148          174
  Steals per game........          4.8          5.6
BLOCKS...................           95          102
  Blocks per game........          3.1          3.3
Dayton (25-6/14-4) vs. Saint Joseph’s (25-7/13-5)
Probable starters:
Dayton
Kyle Davis 7.9 ppg
Charles Cooke 15.8 ppg
Scoochie Smith 11.6 ppg 4.1 apg
Dyshawn Pierre 12.8 ppg 8.8 rpg
Kendall Pollard 10.6 ppg
Saint Joseph’s
DeAndre Bembry 17.2 ppg 7.8 rpg
Isaiah Miles 17.9 ppg 8.0 rpg
Shavar Newkirk 8.3 ppg
Aaron Brown 10.0 ppg
Pierfrancesco Oliva 4.0 ppg
How they got here
Dayton defeated Richmond, 69-54 in the A-10 quarter-finals. Saint Joseph’s came from behind to knock off George Washington, 86-80.
Previous meetings
Saint Joseph’s defeated Dayton, 79-70 on February 17.
Dayton Game Notes Saint Joseph’s Post-Season Guide
TEAM STATISTICS UD
OPoints per game 73.0
Scoring margin +7.7 –
FIELD GOALS-ATT 788-1714
Field goal pct . 4 6 0
3 POINT FG-ATT 209-599
3-point FG pct . 3 4 9
3-pt FG made per game 6.7
FREE THROWS-ATT 478-712
Free throw pct . 6 7 1
F-Throws made per game 15.4
REBOUNDS 1200
Rebounds per game 38.7
Rebounding margin +5.6 –
ASSISTS 454
Assists per game 14.6
TURNOVERS 404
Turnovers per game 13.0
Turnover margin -0.7 –
Assist/turnover ratio 1.1
STEALS 180 150
Steals per game 5.8
BLOCKS 136
Blocks per game 4.4
TEAM STATISTICS                    SJU          OPP
---------------------------------------------------
SCORING..................         2469         2224
  Points per game........         77.2         69.5
  Scoring margin.........         +7.7            -
FIELD GOALS-ATT..........     866-1924     817-1976
  Field goal pct.........         .450         .413
3 POINT FG-ATT...........      226-693      257-822
  3-point FG pct.........         .326         .313
  3-pt FG made per game..          7.1          8.0
FREE THROWS-ATT..........      511-716      333-483
  Free throw pct.........         .714         .689
  F-Throws made per game.         16.0         10.4
REBOUNDS.................         1237         1143
  Rebounds per game......         38.7         35.7
  Rebounding margin......         +2.9            -
ASSISTS..................          480          407
  Assists per game.......         15.0         12.7
TURNOVERS................          321          366
  Turnovers per game.....         10.0         11.4
  Turnover margin........         +1.4            -
  Assist/turnover ratio..          1.5          1.1
STEALS...................          164          142
  Steals per game........          5.1          4.4
BLOCKS...................          110           79
  Blocks per game........          3.4          2.5

Leave a Reply