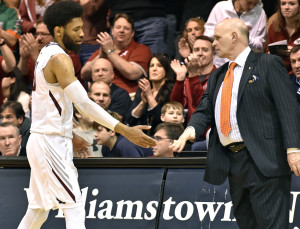
The Atlantic 10 finals tip off at 12:30 p.m. on CBS. Here’s your guide:
VCU (24-9/14-4) vs. Saint Joseph’s (26-7/13-5)
Probable starters:
VCU
Melvin Johnson 18 ppg
Johnny Williams 3.8 ppg
Korey Billbury 11.2 ppg
JeQuan Lewis 10.3 ppg
Mo Alie-Cox 10.5 ppg
Saint Joseph’s
DeAndre’ Bembry 17.2 ppg 7.8 rpg
Isaiah Miles 17.9 ppg 8.0 rpg
Shavar Newkirk 8.3 ppg
Aaron Brown 10.0 ppg
Pierfrancesco Oliva 4.0 ppg
How they got here
VCU beat UMass, 85-70 and Davidson, 76-54.
Saint Joseph’s came from behind to defeat George Washington, 86-80 and outlasted Dayton in the semi-finals, 82-79.
Previous meeting
In their only meeting this season, VCU won at Saint Joseph’s, 85-82.

VCU advanced to its fourth straight A-10 Championship, the first A-10 team to accomplish that since UMass 1992-96. The Rams are making their sixth consecutive conference championship final appearance having reached the Colonial Athletic Association final in 2011 and ’12 before joining the A-10. Saint Joseph’s defeated VCU in the 2014 final.
VCU is 13-2 over the past five years at conference championships. The Rams are 23-1 over the past two years when holding opponents to shooting under 30 percent from behind the arc. VCU’s Will Wade is looking to become the first, first-year A-10 coach to win the title since Thad Motta and Xavier won the 2002 final. VCU is 22-3 this season when scoring 70 or more.
Saint Joseph’s 26 wins is tied for second most in school history – the Hawks won a record 30 games in 2003-04. The Hawks are 20-1 this year when leading at halftime and 8-1 when scoring 80 or more points. Saint Joseph’s is looking for its fourth A-10 Championship title having also won in 1997 and 1986.
VCU Game Notes Saint Joseph’s Game Notes
TEAM STATISTICS VCU
SCORING 2475
Points per game 77.3
Scoring margin +10.3 –
FIELD GOALS-ATT 897-1990
Field goal pct . 4 5 1
3 POINT FG-ATT 230-640
3-point FG pct . 3 5 9
3-pt FG made per game 7.2
FREE THROWS-ATT 451-653
Free throw pct . 6 9 1
F-Throws made per game 14.1
REBOUNDS 1199
Rebounds per game 37.5
Rebounding margin +2.7 –
ASSISTS 463
Assists per game 14.5
TURNOVERS 374
Turnovers per game 11.7
Turnover margin +4.2 –
Assist/turnover ratio 1.2
STEALS 290
Steals per game 9.1
BLOCKS 123
Blocks per game 3.8
TEAM STATISTICS                    SJU          OPP
---------------------------------------------------
SCORING..................         2469         2224
  Points per game........         77.2         69.5
  Scoring margin.........         +7.7            -
FIELD GOALS-ATT..........     866-1924     817-1976
  Field goal pct.........         .450         .413
3 POINT FG-ATT...........      226-693      257-822
  3-point FG pct.........         .326         .313
  3-pt FG made per game..          7.1          8.0
FREE THROWS-ATT..........      511-716      333-483
  Free throw pct.........         .714         .689
  F-Throws made per game.         16.0         10.4
REBOUNDS.................         1237         1143
  Rebounds per game......         38.7         35.7
  Rebounding margin......         +2.9            -
ASSISTS..................          480          407
  Assists per game.......         15.0         12.7
TURNOVERS................          321          366
  Turnovers per game.....         10.0         11.4
  Turnover margin........         +1.4            -
  Assist/turnover ratio..          1.5          1.1
STEALS...................          164          142
  Steals per game........          5.1          4.4
BLOCKS...................          110           79
  Blocks per game........          3.4          2.5

Leave a Reply