By Ian Levy
It’s time for another look at some NBA Power Rankings. To review, my Power Rankings are different from many others in that I don’t use any subjective judgements, instead relying on a very specific statistical measurement. These Power Rankings are based on the Differential between each team’s Offensive and Defensive Ratings.
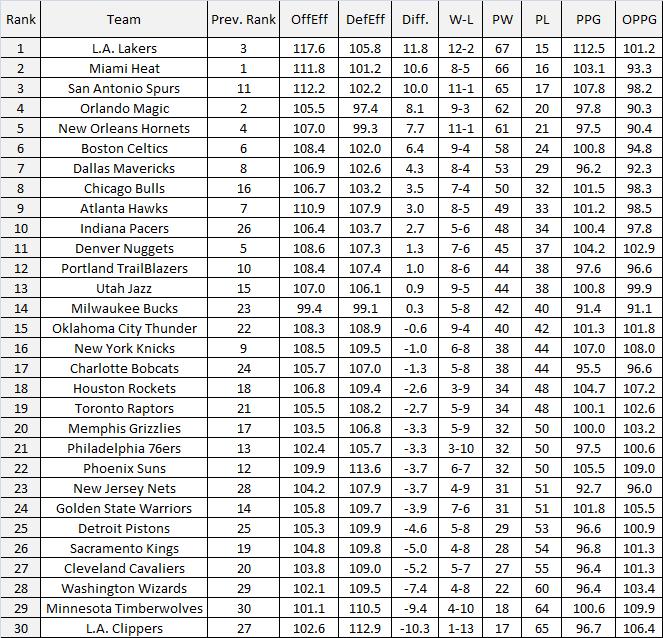
Offensive and Defensive Ratings show how many points a team scores or allows per 100 possessions rather than per game. This is a much more effective way of accounting for a team’s offensive or defensive performance in that it factors in the speed or pace a team plays at. Below is a table showing my rankings, current through today.
If you missed the first edition of these Power Rankings, the first two columns after the rankings are the Offensive and Defensive Ratings for each team. The third column is the Differential between the two, and this is the category I used for my rankings; the Lakers as the best team in the league, the Clippers as the worst. Next you have each team’s record as of last night.
The next two columns represent each team’s Pythagorean Win Loss record. The Pythagorean record is a projection of how many games each team would win if they maintained the same point differential across 82 games. It’s important to note that this is not a projection in the traditional sense. This projection is based solely on the team’s play up to this point and doesn’t take into account any future factors such as injury or strength of schedule. The idea is if each team played at the exactly same level as they had in the first few weeks across the entire of the season what would their record be. A team’s points scored and allowed per game is needed to calculate the Pythagorean record and those are the last two columns in the table.
It may surprise many to still see Miami so close to the top spot despite their 8-5 record. Their rating is inflated by their blowouts of bad teams, but as Neil Paine of Basketball-Reference pointed out last week, beating up on the weak teams correlates with postseason success more than any other type of win.
The biggest gains since our last edition were made by Chicago, Indiana, San Antonio, Milwaukee and Oklahoma City. The biggest losses were made by Denver, Golden State, Cleveland, Sacramento, and Phoenix. The three worst teams in the league, Washington, Minnesota and the Clippers, have remained consistent despite reordering themselves.
One really interesting case on this list is Oklahoma City. Thunder are ranked 15th on our list and have posted a record of 9-4 despite having a negative differential. The Thunder have already won 4 games this season by two points or less. The key for them has been their league leading FTR at 0.342. Their abnormally high FTR is giving them wins in close games and inflating their win total, which disguises some serious offensive and defensive problems. A more complex view of the numbers will give the impression that the Thunder have not been playing nearly as well as their record indicates.
Stay tuned for future editions of these Power Rankings!
Ian’s basketball writing can also be found at Hickory-High.com and IndyCornrows.com


I was wondering how strength of schedule might impact the rankings. For example, 9 of the Lakers 14 games have come against teams in the bottom third.
John Hollinger’s and most other statistical based power rankings use strength of schedule. It’s something I hope to incorporate eventually. Let’s say I’m pacing myself.